Person installing a window
Logo Group A

Last updated: 9 July 2026

Personalized data cards with self-defined regions in Power BI for Group A

Group A, the umbrella organization behind Kwadro and Belisol in the construction and retail sector, needed to visualize showroom regions that did not align with standard administrative boundaries. ACA Group developed a custom map visualization in Power BI to accurately represent branch groups based on real locations. This business intelligence solution improves data visualization, enables better regional analysis, and supports more informed, data-driven decision-making.

Read more
Share via:
01

Challenge

Group A needed to clearly map out customized branch groups (regions based on showroom locations) to improve data visualization and reporting. The existing maps only allowed for official boundaries, which limited their ability to display KPIs and other data tailored to their operational needs.


02

Solution

A customized map layer was created using a TopoJSON file with custom branch groups based on ZIP codes. The solution was integrated into Power BI, leveraging its capabilities for scalable and user-friendly self-service BI dashboards.


03

Approach

The data for Group A was collected, including the assignment of municipalities to industry groups. A customized map layer was created using Mapshaper, combining ZIP code data with StatBel’s conversion tables. This layer was visualized in Power BI, allowing users to zoom in on data at the municipal level.


04

Result

A clear, interactive dashboard in Power BI enabled Group A to visualize and analyze KPIs, online leads, customer data, and sales figures by branch group. The solution improved decision-making and operational efficiency and met Group A’s requirements for customized reporting.

Group A Logo

About Group A

Group A is the parent company of Kwadro and Belisol. They operate in Belgium, the Netherlands, and France and specialize in exterior joinery made of aluminum, PVC, and wood, as well as in the installation of windows and roller shutters. Belisol has grown to become the largest supplier of doors and windows in Belgium and the Netherlands.

Challenge

Clearly map out all of Group A’s locations

To visualize certain KPIs and other key data, Group A wanted to use a map of custom regions showing their locations. Group A refers to these as “branch groups.” These regions or branch groups are based on the geographic locations of their showrooms. However, because it was only possible to visualize official Belgian or Flemish municipal boundaries, they needed assistance to report their figures in the desired way.

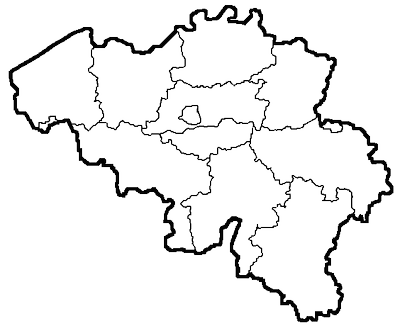
Everyone is familiar with the map of Belgium shown below, which can be divided into regions, provinces, districts, and municipalities:

Group A asked us to customize this map and distribute it to the industry groups mentioned above. These groups typically consist of a combination of different municipalities in which one or more showrooms are located. This allows them to extend beyond provincial boundaries, resulting in a new breakdown of the familiar map.

The reason for dividing this map into branch groups is so that their employees can use the resulting reports in their daily work: to display different types of figures by branch group, track the number of online leads or calls from new customers, and review specific sales figures.

Map of Belgium
Solution

Clear dashboard in Power BI

Group A was already using Microsoft Power BI. Power BI is an integrated, user-friendly, and easily scalable platform for self-service BI. By establishing connections between your data and using visualizations, you gain deeper insights into your data. With the help of the platform, you can build impressive data experiences that provide you with insights to make better decisions.

Approach

Get started on your own with self-service BI

With self-service BI, employees who aren’t very familiar with data or have limited technical knowledge can work with specific data on their own and easily set up and view dashboards.

Together with Group A, we began collecting data they already had available, such as a mapping of which municipality belongs to which industry group. We then searched for a map of Belgium in TopoJSON format, a specific file format that encodes topology.

Since the branch groups were already defined by ZIP code, we chose a map with a breakdown by municipality and with ZIP code as one of the attributes. Since only maps with NIS codes as an attribute were available, we created a map layer ourselves and added the ZIP code as an attribute based on StatBel’s most recent conversion table.

After creating this map layer, we added the branch group data as an attribute based on ZIP code. Once this was added, we were able to reorganize the map based on branch group. Creating map layers, adding attributes, and rearranging map layers was always done using the free Mapshaper tool.

Result

Easily view the desired data by industry group

We then further developed the various map layers in Power BI. There are many visuals available that allow you to combine multiple map layers. In this way, we created a map visual that can display specific metrics by industry group and allows users to drill down to the underlying municipalities for each industry group. For example, Group A can display revenue figures by industry group on the map. When a specific industry group is clicked, the revenue figures are displayed for each municipality within that selected industry group.

I approached ACA with a fairly specific request: I wanted to visualize certain figures on a map, with a selective display of our own sales regions and a breakdown within those regions. In no time at all, ACA’s data team made this happen for me. Communication was excellent, and they strove to deliver exactly what I had in mind. This approach led to the desired result!

Patricia Alen
Marketing Director at Group A
Group A Logo
Photo by Patricia Alen
"I approached ACA with a fairly specific request: I wanted to visualize certain figures on a map, with a selective display of our own sales regions and a breakdown within those regions. In no time at all, ACA’s data team made this happen for me. Communication was excellent, and they strove to deliver exactly what I had in mind. This approach led to the desired result!"
Patricia AlenMarketing Director at Group A
Group A Logo
Photo by Patricia Alen

Related Case Studies

From customized data dashboards to advanced BI solutions, we help companies turn data into actionable insights. Check out our related case studies and see what’s possible! 🚀

The Flemish government (public sector) faced fragmented real estate data spread across multiple agencies, making it difficult for citizens and stakeholders to access certificates, permits, and reports. ACA Group developed the Gebouwenpas, a scalable digital platform built on Liferay DXP with Spring Boot and Angular, centralising all building data into a single digital passport. Using an agile Scrum and Kanban approach, the solution delivers clear insights, secure access, and a future-proof system for both residential and non-residential properties.
OVAM_dossierdoolhof
OVAM_dossierdoolhof
OVAM-Leeuw-engels_groen-letteromtrek
I am ten, a marketing agency working with diverse project types such as retainers and time-based assignments, struggled to turn fragmented Jira data into actionable management insights. ACA Group implemented JirAlytics, a data platform built on top of Jira that integrates with tools like Power BI to centralise reporting on billability, budgets, and timesheets. This resulted in a scalable, centralised reporting environment, enabling management to monitor performance and make faster, data-driven decisions across all projects.
I am ten
I am ten
I am tem logo transparent
OVAM, the Public Waste Agency of Flanders, faced operational inefficiencies due to legacy IT systems and manual processes in case management and field operations. ACA Group implemented multiple applications using OutSystems low-code technology, including a web-based case management system, a mobile inspection app, and an asbestos cost calculation tool. This approach automated workflows, improved data accuracy, and reduced administrative effort, enabling faster processes, scalable digital solutions, and cost-efficient digital transformation across the organization.
sustainability visual
OVAM-Leeuw-engels_groen-letteromtrek
Smart Region Limburg (s-Lim), a collaboration of local governments, needed to reduce fragmentation in municipal communication and services across multiple municipalities. ACA Group developed Mijn Stadsapp, a cross-platform mobile application built with React Native that integrates data from various sources such as municipal websites, event platforms, and utility services. This solution centralizes local information and services in one app, improving citizen engagement and accessibility, and achieved rapid adoption with over 20,000 downloads in the first month.
mijn-stadsapp-bg-landscape
1717581376-s-lim-logo-transparant
A major Belgian bank needed to modernize its data management strategy to overcome limitations of centralized data architectures and enable scalable, domain-driven data usage. ACA Group guided the transition to a Data Mesh approach, combining strategic consulting, stakeholder alignment, and hands-on implementation of a self-service data platform using technologies such as Kubernetes. This resulted in a validated data product model, improved data ownership, and a scalable architecture that accelerates data-driven innovation and governance across the organization.
data mesh
data mesh
ACA Group logo
ACA Group, an international technology consultancy, faced fragmented onboarding processes across multiple offices, tools, and business units, creating inefficiencies for HR and inconsistent employee experiences. To address this, ACA Group developed N-ACA, a custom onboarding platform built with OutSystems low-code technology. The platform centralizes onboarding content, enables progress tracking, and standardizes workflows. This solution improved onboarding quality, reduced administrative workload for HR, and accelerated time-to-productivity for new employees.
rocket
rocket
ACA Group logo
The Flemish government (public sector) faced fragmented real estate data spread across multiple agencies, making it difficult for citizens and stakeholders to access certificates, permits, and reports. ACA Group developed the Gebouwenpas, a scalable digital platform built on Liferay DXP with Spring Boot and Angular, centralising all building data into a single digital passport. Using an agile Scrum and Kanban approach, the solution delivers clear insights, secure access, and a future-proof system for both residential and non-residential properties.
OVAM_dossierdoolhof
OVAM_dossierdoolhof
OVAM-Leeuw-engels_groen-letteromtrek
I am ten, a marketing agency working with diverse project types such as retainers and time-based assignments, struggled to turn fragmented Jira data into actionable management insights. ACA Group implemented JirAlytics, a data platform built on top of Jira that integrates with tools like Power BI to centralise reporting on billability, budgets, and timesheets. This resulted in a scalable, centralised reporting environment, enabling management to monitor performance and make faster, data-driven decisions across all projects.
I am ten
I am ten
I am tem logo transparent
OVAM, the Public Waste Agency of Flanders, faced operational inefficiencies due to legacy IT systems and manual processes in case management and field operations. ACA Group implemented multiple applications using OutSystems low-code technology, including a web-based case management system, a mobile inspection app, and an asbestos cost calculation tool. This approach automated workflows, improved data accuracy, and reduced administrative effort, enabling faster processes, scalable digital solutions, and cost-efficient digital transformation across the organization.
sustainability visual
OVAM-Leeuw-engels_groen-letteromtrek
Smart Region Limburg (s-Lim), a collaboration of local governments, needed to reduce fragmentation in municipal communication and services across multiple municipalities. ACA Group developed Mijn Stadsapp, a cross-platform mobile application built with React Native that integrates data from various sources such as municipal websites, event platforms, and utility services. This solution centralizes local information and services in one app, improving citizen engagement and accessibility, and achieved rapid adoption with over 20,000 downloads in the first month.
mijn-stadsapp-bg-landscape
1717581376-s-lim-logo-transparant
A major Belgian bank needed to modernize its data management strategy to overcome limitations of centralized data architectures and enable scalable, domain-driven data usage. ACA Group guided the transition to a Data Mesh approach, combining strategic consulting, stakeholder alignment, and hands-on implementation of a self-service data platform using technologies such as Kubernetes. This resulted in a validated data product model, improved data ownership, and a scalable architecture that accelerates data-driven innovation and governance across the organization.
data mesh
data mesh
ACA Group logo
ACA Group, an international technology consultancy, faced fragmented onboarding processes across multiple offices, tools, and business units, creating inefficiencies for HR and inconsistent employee experiences. To address this, ACA Group developed N-ACA, a custom onboarding platform built with OutSystems low-code technology. The platform centralizes onboarding content, enables progress tracking, and standardizes workflows. This solution improved onboarding quality, reduced administrative workload for HR, and accelerated time-to-productivity for new employees.
rocket
rocket
ACA Group logo

Share this case

Share via: